The average top15 rates for NHG 20 years still 0.40% from target level
The big question in today’s mortgage market in The Netherlands: How quickly is the mortgage market responding to capital market changes. The answer is: very slow. Is there statistical proof. Yes, there is even proof. And it is easily visible in the graph below. It contains the average weekly 13Y swap rates, the average weekly top15 mortgage rates (20Y NHG), and the spread between the 2 graphs.
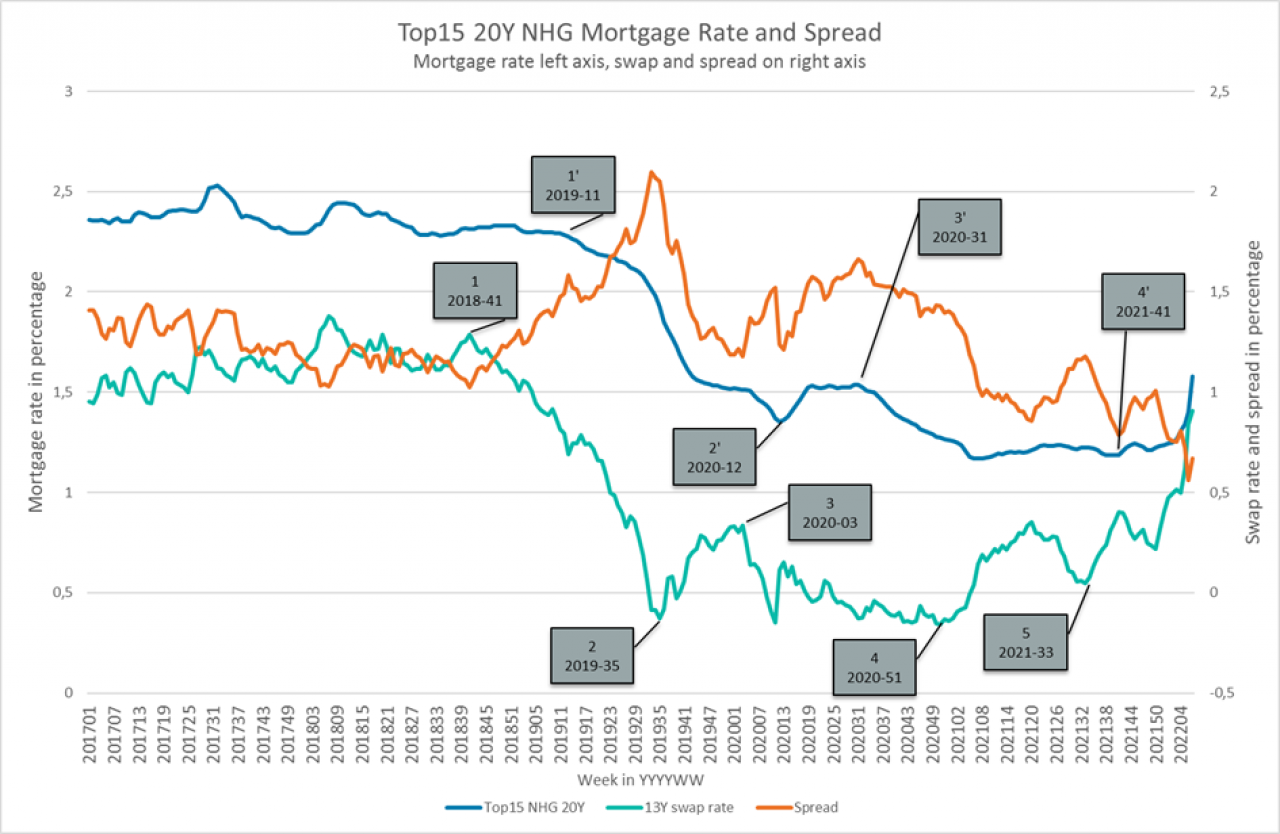

Point 1 and point 1’: It was 2018-41 that swap rates reaches the point to decrease. It was week 2019-11 that rates started to decrease seriously. Difference? 22 weeks.
Point 2 and point 2’: The long term decrease in swap rates lasted for a long term. Look at point 2 and 2’. Minimum is week 2019-35. When did mortgage rates start to increase? 2020-12. That is even 29 weeks after swap rates bottomed. Thereafter, the average mortgage rates started to follow.
Did the market follow with rate increases? A little bit, see point 3 and 3’. Capital markets peaked in week 2020-03. The peak in the mortgage market? 2020-31. Again, a delay of 28 weeks.
Then the minimum level of capital markets in 2020-51. This should be a nice predictor of rate minimum rates around week 2021-20. Too bad. The minimum was reached in 2021-31. The temporary decrease in swap rates during the summer in 2021 (week 2021-22 to 2021-33) created a hesitant market. See point 4 and 4’.
A further acceleration is shown in point 5. After 2021-33, the capital markets moved north in a straight line. The mortgage rates? They started to increase in week 2021-41 (or 2021-49). A lag of 8 or 16 weeks, but very modest and not in line with the fast and furious mode of the capital markets. Since the end of 2021, margins have eroded by almost 0.50%.
Conclusion? The average top15 mortgage rates will increase if capital market rates will stay at current levels. Margins are too tight in this market. There is room for 0.50% to increase in 20Y NHG rates without movement in capital market rates. During week 2022-07, the average mortgage rates increased to 1.71% (end of the week) from 1.39% during week 2022-06. This jump is by far not yet enough to catch up with the recent increase in swap rates.
Another conclusion? Yes, there is a delay of mortgage rates responding to capital market rates. On average it is about 20 weeks. But be aware, in times in rising interest rate environments, at some point you should fasten your seatbelts.
A statistical approach
This is what happens if we shift the swap rates 20 weeks to the right:
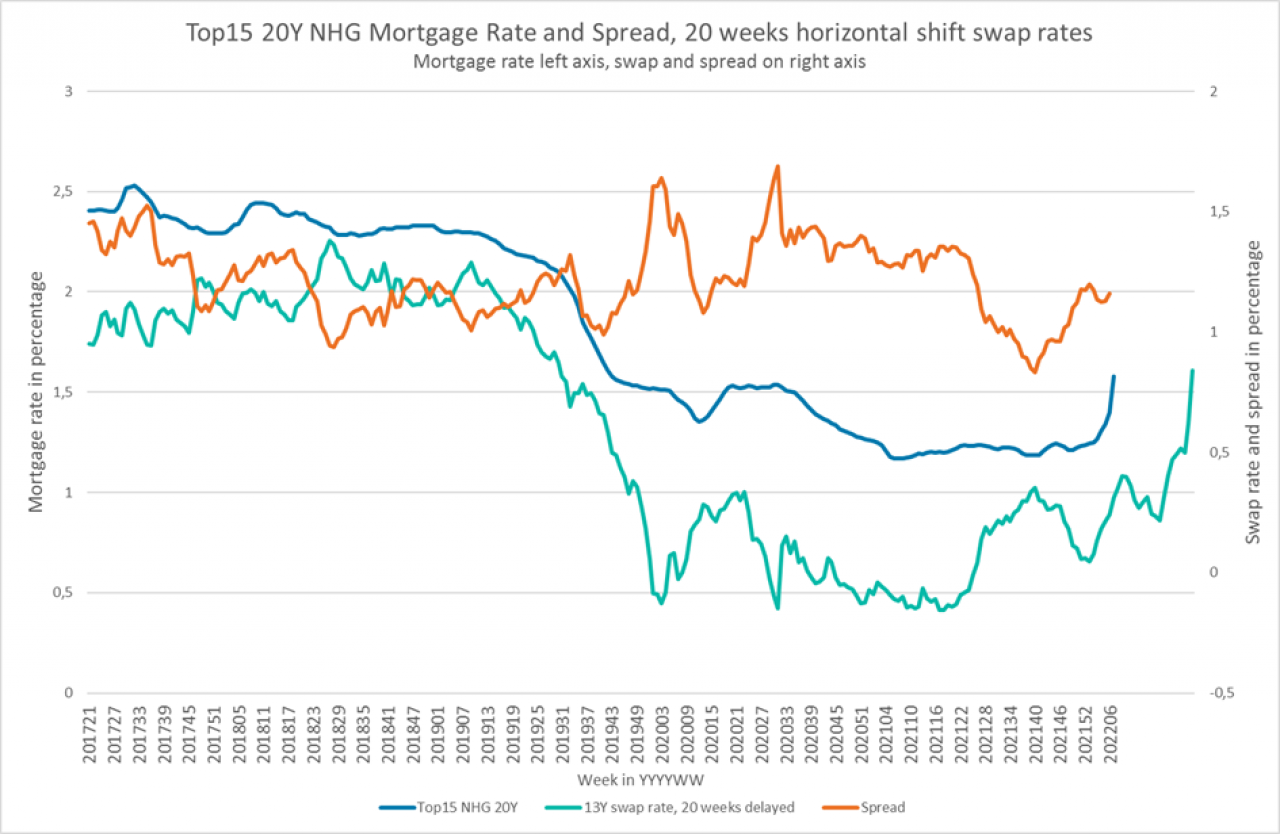
It is clear that the orange line has flattened compared to the first graph. Also, the movements in the mortgage rates are much more aligned with the movements in swap rates. That is the result of the least square analysis that we performed on each week delay in swap rates. The least square analysis showed that the best predictor of today’s mortgage rates is the swap rate of 20 weeks ago. In other words, that means that the time series of the spreads resulting from a 20 weeks delay is statistically the flattest if we analyze each delay of the swap curve between 0 and 30 weeks. Again in other words: in case we delay the swap rates by 20 weeks, the graph of the mortgage rates and the graph of the swap rate are the best look-a-likes.
In the relatively stable period during 2020-01 to 2021-40, the average 20 weeks delayed margin was around 1.30% for 20Y NHG, calculated over 13Y swaps. The above analysis suggests that, if swap markets cool down from now on and stay at current levels (around 0.90%), in 20 weeks’ time, the average top15 mortgage rates for NHG 20Y will have increased to approximately 2.20%. The average NHG top15 20Y during week 2022-07 was around 1.6% (but 1.7% by Friday February 18). Before we see 2.20% for the top15 of the market, we will need a lot of additional rate increases over the coming months. Please note that the entire market needs to increase, and not just the top15. If the top15 increases, today’s sub-top will become next week’s top15. Only if the top30 moves by the same increase in rates, the increase if today’s top15 will have an 1:1 effect in calculating next week’s top15.
Background pricing mortgage rates
The rate of a mortgage loan is driven by the following factors. First of all, there is the movement in swap rates. Swap rates are the Euro standard for exchanging euribor 3 months rates for long term interest rates. Forget the technical details, it is all about the movement in German Bunds, the rate at which the German Government can borrow in the capital markets. If Germany stays strong in economic and financial sense, and Euro inflation expectations are low, Germany can borrow at low rates. As a consequence, that keeps the Euro swap rates low. If any of the components move, the German rate will move.
A second driver of mortgage rates is the level at which mortgage lenders can refinance their portfolios. This is called the credit spread. Remember the mortgage rates in 2009 and beyond. There was no buyer of mortgage exposure in that period. As a result, credit spreads (and thus mortgage rates) went north. Despite lower and lower base interest rates in the Euro zone, the mortgage market took into account the fact that there was no opportunity to resell the mortgage portfolios, unless a huge premium was paid to the buyer. That explained the higher gross margin (mortgage rate minus swap rates) for a long period of time since the credit crunch in 2008/9.
Besides gross margin defined as “mortgage rate minus swap rates and credit spread”, the mortgage investors will take into account risks and costs like: pipeline risk (I offer a rate today, but I don’t know whether the offer will result in a loan after 2 months, and what will my swap rate be after 2 months if the offer results in a loan), prepayment risk (I offer the borrower options to prepay without costs, so I don’t exactly know how long I will have the borrower in my portfolio, but I need to assume the borrower will be there for a certain time, in order to match it with my liabilities) and credit risk (the borrower may pay his scheduled payments, but he may fail, and then I have to foreclose on his property at an uncertain market value of the property).
Examples of direct costs are the costs of origination (I need to put people at work to assess the application, collect documentation, get final approval and pay out the mortgage loan), the cost of ongoing servicing (I need to keep a system up and running to collect payments) and special servicing (I need to call the borrower in case he hasn’t made his payment). By the way, I need to make a return on the capital that I have put aside to finance the loan, which is called by return on equity. The amount of capital is highly dependent of the regulation of the ECB and may change frequently, but never in my favor since last 14 years.
So, let’s assume, the direct costs and return on equity are constant over the years. Second assumption, the credit spreads have been relatively stable since 2017 (which is a challengeable assumption, it may have decreased since 2017 to some extend). As a consequence, the movement of mortgage rates is mainly driven by movements in the swap market. Interesting conclusion in this time of sharply increasing swap rates.